August 20, 2026 · 12 min read
Chatbot KPIs: Key Metrics You Must Track
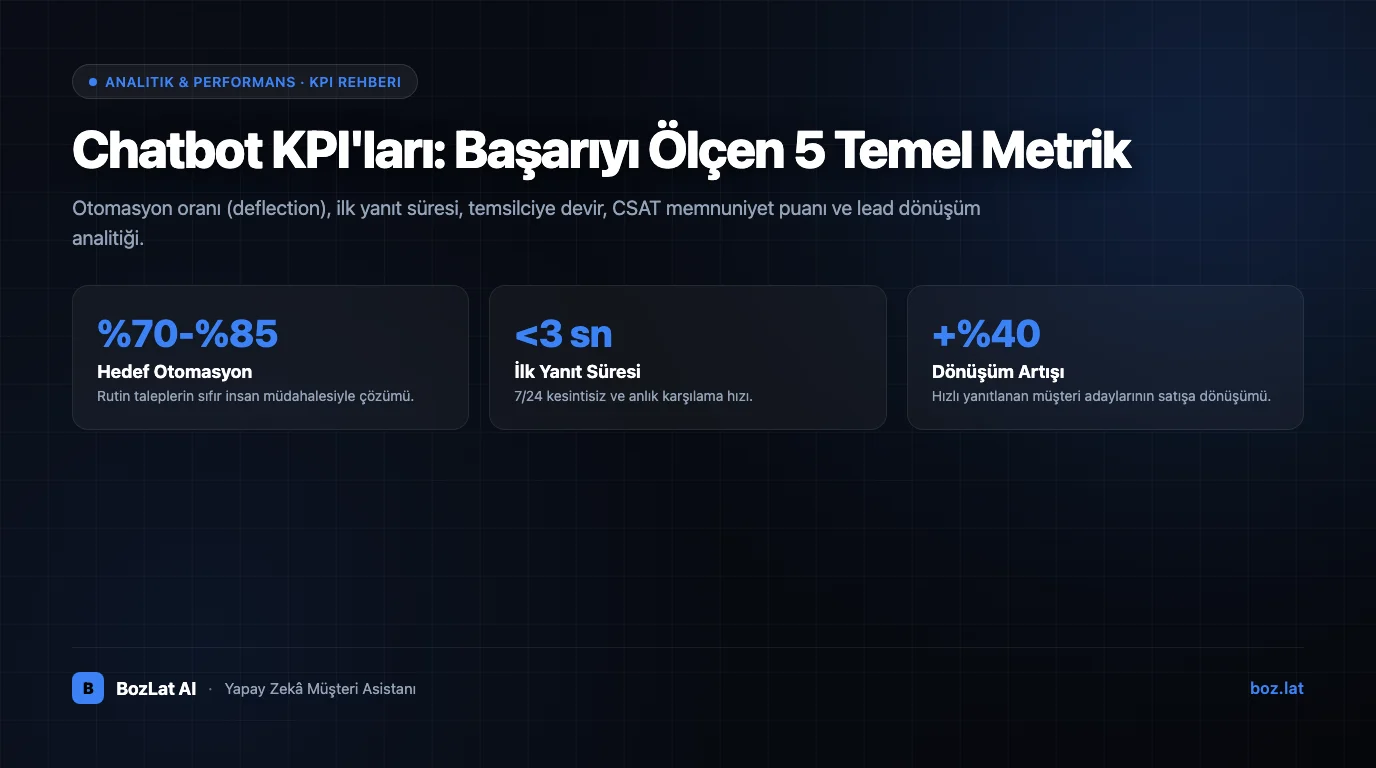
The only way to know whether a chatbot investment is working is to measure the right Key Performance Indicators (KPIs). Yet the most common mistake is to watch the number that sits most prominently on the dashboard: total message volume. That number tells you how busy the bot is, not how useful it is. Message volume also rises when the bot answers incorrectly and the customer repeats the question three times.
This guide defines the metrics that actually measure chatbot success, and for each one gives the calculation formula, a sensible target range, and the situation in which the metric will mislead you.
What is a chatbot KPI?
A chatbot KPI is a performance indicator that quantifies how much automated customer communication contributes to a specific business goal. The critical part of that definition is "a specific business goal": a metric stripped of its context is not a KPI, it is just a number.
For example, a 90% deflection rate is not automatically good news. If the bot closes conversations it cannot answer by stalling the customer, deflection rises while satisfaction and sales fall. This is why KPIs are always read paired with at least one counter-metric.
Before you measure: which goal are you tying it to?
The same bot is judged by different metrics depending on the goal it serves. Choose the goal first, then build the KPI set:
- Reducing support cost: primary metrics are deflection rate and cost per conversation; counter-metrics are CSAT and repeat contact rate.
- Generating sales and bookings: primary metrics are conversion rate and qualified conversation count; counter-metrics are handover rate and answer accuracy.
- Guaranteeing response speed: primary metrics are first response time and after-hours coverage; the counter-metric is resolution rate.
Core chatbot KPIs and how to calculate them
1. Deflection rate
The share of conversations that end without ever being escalated to a human agent. It is the most used and most misread metric.
Formula: (Conversations not escalated ÷ Total conversations) × 100
Exclude greeting-only and spam sessions from the denominator, otherwise the rate inflates artificially. In a mature setup 60-85% is a reasonable target, though a lower rate can be perfectly healthy for businesses with high question diversity.
2. Containment versus genuine resolution
Containment means the conversation ended inside the bot. Resolution means the customer's need was actually met. They are not the same thing, and the gap between them is the most expensive misunderstanding in chatbot analytics.
Formula: (Bot conversations with no repeat contact on the same topic within 24 hours ÷ Contained conversations) × 100
If repeat contact is climbing, an improvement in deflection is an illusion: the customer is coming back because nothing was solved.
3. First response time (FRT)
The interval between the customer's message and the first meaningful reply. This is where automation delivers its clearest advantage, with bot targets measured in seconds.
What must be measured is the first meaningful answer, not the automated "Hi, how can I help you?" greeting. A dashboard that counts the greeting as FRT renders the metric meaningless.
4. Agent handover rate
The share of conversations routed to live support. Low is not always good: a near-zero handover rate can mean the bot is holding on to conversations it should be escalating.
Formula: (Escalated conversations ÷ Total conversations) × 100
Read this metric together with post-handover CSAT. If handover is low but satisfaction among escalated conversations is also low, the bot is escalating too late.
5. Conversion rate and revenue contribution
For commercial deployments this is the KPI that matters most. It measures how often a conversation turns into a booking, quote or order.
Formula: (Conversations completing the target action ÷ Conversations with commercial intent) × 100
Put only intent-bearing conversations in the denominator, not every session. Counting "what are your opening hours?" against conversion depresses the rate for no reason and hides real performance.
6. CSAT and CES
CSAT measures end-of-conversation satisfaction; CES measures the effort the customer had to spend to reach an outcome. In most support scenarios CES gives an earlier warning than CSAT, showing friction before the customer complains.
Remember that survey respondents tend to sit at the extremes; never read CSAT alone, always alongside repeat contact and handover rates.
7. Answer accuracy and hallucination rate
In AI-driven bots this is the most neglected and most critical metric. It is calculated by human-labelling a weekly random sample of conversations.
Formula: (Answers contradicting the knowledge base or containing invented facts ÷ Answers reviewed) × 100
The target should be close to zero. A rising hallucination rate invalidates every other KPI. See our guides on preventing hallucinations and what RAG is.
8. Cost per conversation
Total cost of ownership divided by conversation count, compared against the cost of human support.
Formula: (Subscription + per-conversation channel fees + amortised setup) ÷ Total conversations
For a breakdown of the cost components see our WhatsApp chatbot pricing guide.
Formula summary
| KPI | Formula | Sensible target range | Counter-metric to read with it |
|---|---|---|---|
| Deflection rate | Not escalated ÷ total conversations | 60% - 85% | CSAT, repeat contact |
| Genuine resolution | No repeat contact ÷ contained | 80%+ | Post-handover CSAT |
| First response time | First meaningful reply - message time | 0 - 5 seconds | Resolution rate |
| Handover rate | Escalated ÷ total conversations | 15% - 30% | Post-handover CSAT |
| Conversion rate | Target action ÷ intent-bearing chats | Varies by business | Answer accuracy |
| Hallucination rate | Incorrect answers ÷ reviewed answers | Near 0% | CSAT |
| Cost per conversation | Total cost ÷ conversations | Below human cost | Resolution rate |
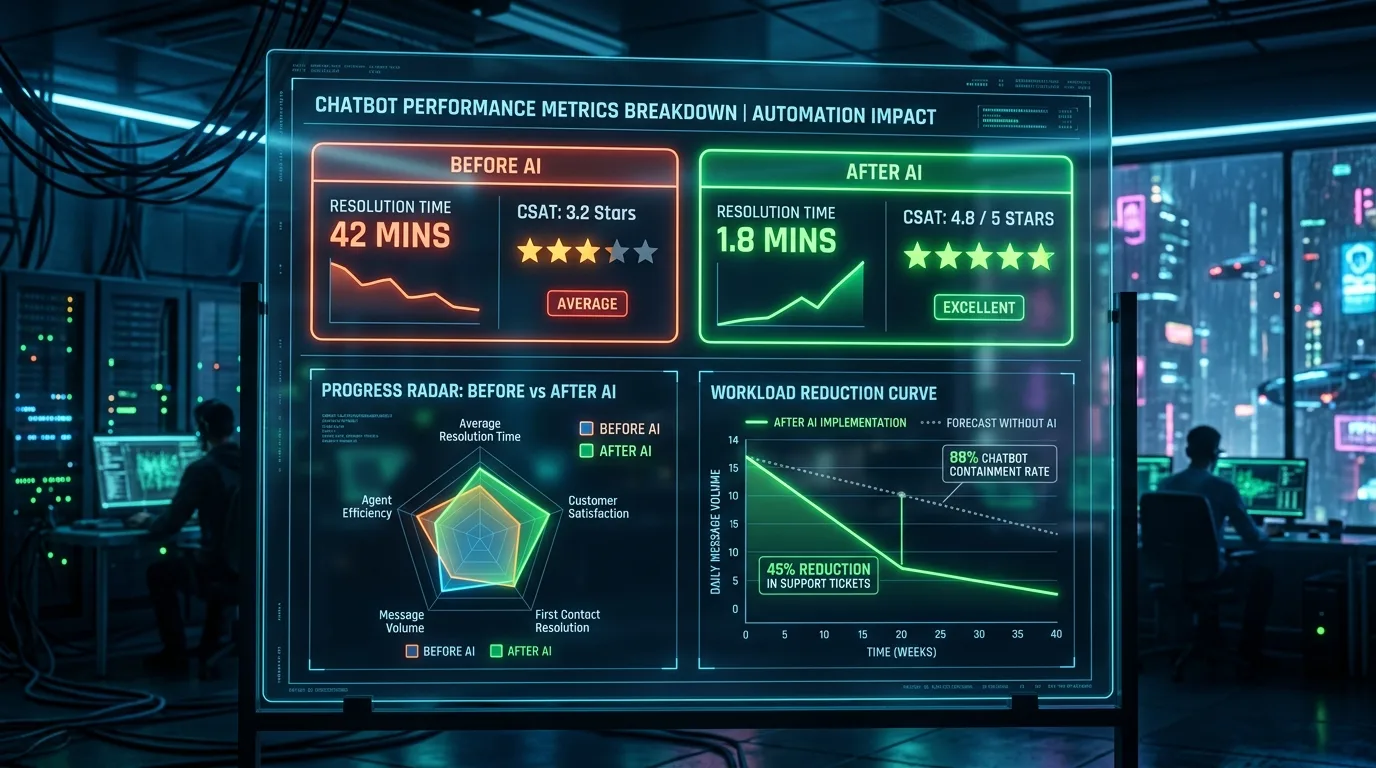
Seven traps that distort chatbot KPIs
- Counting the greeting as FRT: the metric looks perfect while the customer experience is unchanged.
- Leaving spam and test sessions in the denominator: artificially inflates deflection.
- Driving handover down in isolation: the bot keeps conversations it should escalate and satisfaction drops.
- Looking only at survey respondents: the silent majority's experience goes unmeasured.
- Averaging channels together: WhatsApp and web chat carry different intent density; the average hides both.
- Not separating business hours from after-hours: the window where the bot adds most value becomes invisible.
- Never measuring hallucination rate: the most expensive failure accumulates silently.
A 30-60-90 day measurement plan
Trying to track every metric from day one splits attention. A staged plan works better:
- Days 1-30, baseline: volume, FRT, handover rate and hallucination sampling only. The goal is not to hit targets but to record the honest starting point.
- Days 31-60, quality: add genuine resolution, repeat contact and CSAT. Derive knowledge-base gaps from escalation reasons.
- Days 61-90, commercial impact: add conversion rate and cost per conversation, then refine bot messaging with A/B testing.
For escalation thresholds and routing rules see our agent handover guide, and for disclosing automation to customers see bot transparency.
Targets differ by industry
There is no single correct target set. As question diversity and transaction risk rise, the automation target falls and the accuracy target rises:
| Business type | Dominant question type | Automation target | Priority KPI |
|---|---|---|---|
| Appointment-based (clinic, salon) | Booking, hours, pricing | High | Conversion and no-show reduction |
| E-commerce | Order status, returns | High | Genuine resolution, repeat contact |
| B2B / professional services | Scope, proposals | Medium | Qualified conversation count |
| Technical service | Fault description, parts | Low-medium | Correct routing rate |
To quantify the revenue impact of missed conversations, use the model in our cost of missed leads article.
Measuring inside the BozLat AI dashboard
The BozLat AI dashboard shows conversation transcripts, escalation reasons and channel-level distribution on a single screen, so the raw data behind the formulas above is available without building manual reports. See our BozLat AI pricing page for packages and scope.
Frequently Asked Questions
Related Articles
5 min read
Does Saying "I am a bot" Hurt Sales?
Should you hide your AI assistant's identity or state it openly? How transparency affects trust, when disclosure is mandatory, and how to phrase it well.
8 min read
AI Assistant vs. Human Secretary: An Honest Comparison
Compare AI assistants and human front-desk staff: explore cost realities, emotional intelligence limits, and the optimal hybrid operational model.
6 min read
Designing Chatbot-to-Human Agent Handover
When should an AI chatbot transfer a conversation to a live customer support agent? Human-in-the-loop architecture and smooth agent takeover.
Ready to set up an AI assistant for your business?
View Pricing